Largest Outcomes Funds To Date By Value (INDIGO, April 2024)
Largest outcomes funds by value deployed according to INDIGO data imported April 2024
Continue Reading Largest Outcomes Funds To Date By Value (INDIGO, April 2024)

Reimagining Finance
As A Planetary Force For Good
Using Data To Unpack & Explore
The Big Thinking Behind Impact
Largest outcomes funds by value deployed according to INDIGO data imported April 2024
Continue Reading Largest Outcomes Funds To Date By Value (INDIGO, April 2024)
If the effect that companies had on the health of their consumers were “monetised,” the average offset would approach $200M according to one estimate.
Estimated figures about the size of the pay for success (PFS) pipeline from the INDIGO project showed a value of > $500M
Continue Reading Pay For Success (PFS) Pipeline Size Estimate – May 2024 (INDIGO)
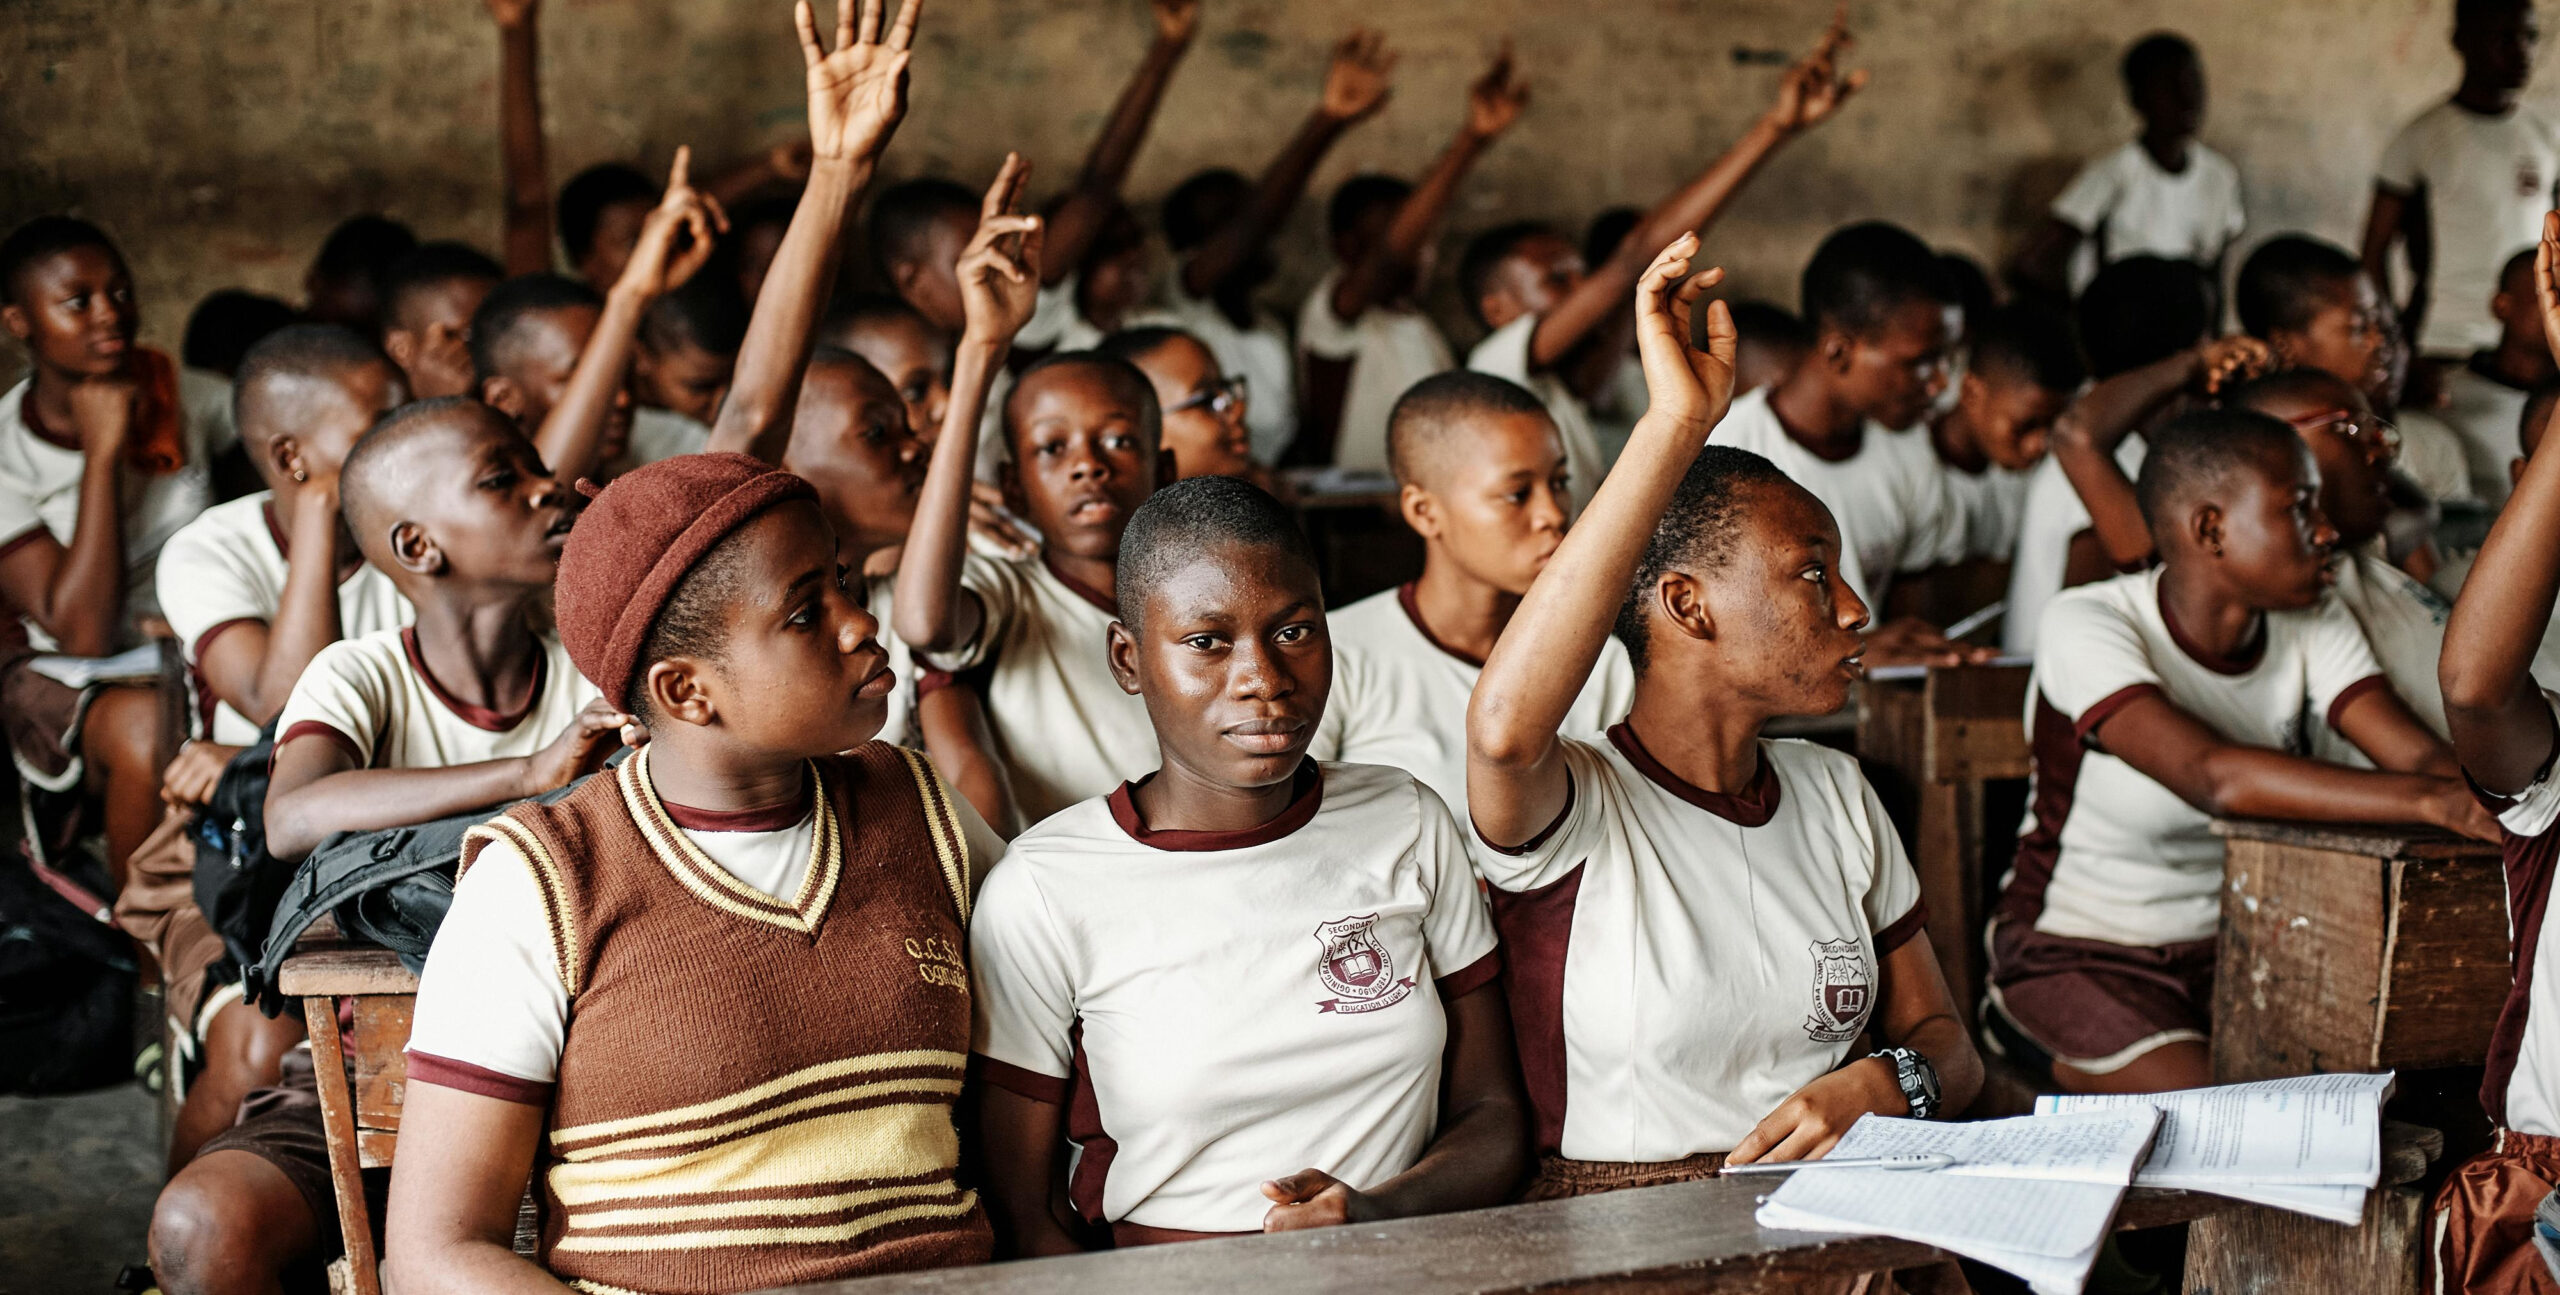
Data from INDIGO shows the disparity in outcomes funds deployments between developed and developing economies around the world.
Data from the INDIGO project at Oxford University shows the extent of the disparity between outcomes funds deployed to developed compared to developing world nations.
Continue Reading Outcomes Funds: Developed vs. Developing World Finance
Largest outcomes funds by value deployed according to INDIGO data imported April 2024
Continue Reading Largest Outcomes Funds To Date By Value (INDIGO, April 2024)
Estimated figures about the size of the pay for success (PFS) pipeline from the INDIGO project showed a value of > $500M
Continue Reading Pay For Success (PFS) Pipeline Size Estimate – May 2024 (INDIGO)
Data from INDIGO shows the disparity in outcomes funds deployments between developed and developing economies around the world.
Data from the INDIGO project at Oxford University shows the extent of the disparity between outcomes funds deployed to developed compared to developing world nations.
Continue Reading Outcomes Funds: Developed vs. Developing World Finance
Many impact approaches focus on improving flows of money directed towards populations in need. This category explores where and how impact is getting involved in development finance (including by stimulating the growth of outcomes funds)
If the effect that companies had on the health of their consumers were “monetised,” the average offset would approach $200M according to one estimate.
Image: IWAI’s 2021 product impact dataset included a quantification of products’ presumed impact on their consumers’ health through assessing their nutritional content. In 2021 the Impact Weighted Accounts Initiative (IWAI) released a dataset using companies’ real financial accounts and showing how numbers would change if their theorised “monetised product impacts” were overlayed on them. The…
Impact subjects that may be of particular interest to corporates wishing to improve their impact performance such as impact accounting and reporting
Impact investing suggests opportunities for private investors to partake in investment opportunities that also involve the achievement of social and environmental good
Estimated figures about the size of the pay for success (PFS) pipeline from the INDIGO project showed a value of > $500M
Continue Reading Pay For Success (PFS) Pipeline Size Estimate – May 2024 (INDIGO)
Posts about projects, strategies, and initiatives related to improving societal themes like income inequality, literacy, access to basic human needs, and more.
Posts about projects, strategies, and initiatives related to improving environmental themes like ocean finance, climate finance, and more
The sustainable debt market has emerged as a powerful force with both corporates and sovereigns issuing debt tied to sustainability objectives (or limited to sustainability-related proceeds).
We think planetary repair should include the financial system.
Business as usual isn’t working out so well for the planet (or humanity). Sorry to start out on such a gloomy note. We brought along some cartoons to lighten the mood a little.

According to recent estimates1, we* are on track to hit only 15% of targets related to the SDGs.
If you haven’t heard about them, the SDGs are a list of really important objectives that humanity is trying to achieve by 2030.
The SDGs were passed unanimously by all 193 of the UN’s member states.
Let’s just say that when the literal entirety of the world’s nations agree on anything, it’s pretty important.
(*we = the planet / humanity)
Speaking of very important things, here’s another one: the global financial system.
Impact says that it’s part of the problem and needs a bit of rethinking.
Impact argues that we need to start thinking about value creation not by reference to how much money we can put into our bank account, but by how much value and positive ‘impact’ we can contribute to the world. It asks for a widening in perspective.
Impact isn’t a new policy platform.
It isn’t ESG after a branding workshop.
It’s not just a type of investing.
Impact is a way to fundamentally change how business works in order to make the world a better and more viable place.
How Does It Suggest Doing All This?
We know what you might be thinking:
I like the sales pitch, but how is impact going to do all these wonderful things in the real imperfect world we live in?
If you want an intro primer, open one of the stories above.
But here’s the TL;DR:
Humanity’s challenges are big and solutions need to be fit for scale
So impact suggests a new rulebook for doing business – one in which profitability means being impact-positive.
That requires that whether we’re investing impactfully or giving away money as a government, impact maximisation is the name of the game
The mission is a big one because it has to be to succeed.
Impact wants to get tens of trillions of dollars moving for the good of humanity and to see financial accounts be a reflection of how good companies are for everyone
Curious To Know More About What Impact?
It’s not a cult (we promise).
But whether you work in policy, save towards a pension, or are just curious as to what this is about, you’re an impact stakeholder.
And impact suggests some seriously big ideas that we think are worth taking seriously
Curious To Learn More?
Choose from one of our two ‘impact stories’

Impact, The Big Idea
Explore the main idea behind impact and how it fits into our quest to find solutions to our planet.
A Quick Guide To Impact Approaches
A quick overview of some of the approaches that impact is using to attempt to improve how the global financial system works
Impact Is Mission-Critical
For The Survival Of Our Planet
Impact is on a determined mission to mobilise mountains of money to put a dent in some of humanity’s most pressing challenges — such as poverty and climate change.
Like a sloth climbing a mountain, seeing bankers trying to figure out a sustainability mission isn’t a sight you might have expected to see. But hey, you’ll see much weirder things than that if you stick around this site.
Why do we need this? Well, there’s a $4 trillion per year2 gap standing between where humanity is now and where it needs to be in order to achieve the sustainability development goals.
To stand any chance of success, we need to find some new ways of moving money around the system.
Impact’s about getting everyone (but especially companies) to realise that we’re all connected on this big thing spinning through space called Planet Earth.
To think about impacts – and how all our actions have repercussions
It’s about optimising the financial system too. But so much more than that.
(And no, it’s not ESG after a branding workshop)
This website was created by a guy called Daniel and is a not-for-profit to help this important cause

Whether you love it as much as our cartoon sloths, disagree with some of its ideas, or just have no idea what it is (yet!), you probably agree that adopting a ‘business as usual’ approach for our planet is a failing strategy.
To try to change things and meet some ginormous objectives, impact suggests bold new ways for our economy to function.
Its central objective is impact-maximisation: Creating the right set of conditions so that businesses can uplift the planet and society by default so that “sustainable business” becomes a redundancy.
Lots of money flows through the public sector, too. Governments collect taxes and try to spend them to better their societies or those in other countries (for example by running aid program).
Here too impact gets thinking, trying to find ways to allow governments to do more with the same resources and trying to find ways for the private and public sectors to work together.
Impact’s not a trendy new way of investing. It’s not just for finance people.
In fact, whether you bought a cup of coffee today or moved millions of dollars worth of assets, you took impact-relevant decisions.
Welcome to the movement. We can all be part of the solution.
Why We Went A Bit Crazy With The Sloth Graphics
We created this website because we were searching for ways to communicate impact’s vision that were new and different. Because we feel that impact is commonly being misunderstood. Or not engaged with because it all seems very complicated.
This is understandable. Impact is a policy-focused discipline because to change policy you need to engage with it and those who formulate it and those folks tend to like things like reports and working groups and all the rest of it.
But it also sometimes means that impact isn’t always easy for regular folks like you and me to understand.
We might find ourselves asking:
What are all these boards and organisations trying to actually achieve and how will it affect you and me? Are they trying to dictate change or are they looking for opinions? If the latter, how do I raise my voice?
We hate to see bureaucracy overshadow the change it’s trying to create so we created this website to try communicate what impact is doing through a less formal means.
So just as much as it’s a data publishing initiative, ImpactDB is actually a communications project.
We’re not so self-important to think that one website can magically change all this in one fell swoop.
But it’s a mission that we’d like to start chipping away at in the hope that even mild wins could unlock some real interest and engagement with our space.
The nuts and bolts of this little operation:
The Impact Database is a not-for-profit publishing entity (we’re working on registration right now!).
We try to take impact data and tell the story behind the numbers – and get people (including the media) interested in impact.
If you produce impact data or somebody that does, you can help us out by getting in touch.
FYI: We Built This Because We Love Impact
The only products ImpactDB currently has for sale are inspiration and amusement.
We don’t sell anything. But especially not data. (Also not tacos, but only because they’re just not core to our mission).
We mention this only because people tend to assume that anyone trying to gather data online has sinister motivations … like compiling a “human’s top impact findings” guide that they try to sell to sloths in the jungle.
If we ask “any chance we could share some of your data?” it’s because we think it would help people understand impact and we’d like to amplify and spotlight it here.
We’re not shady, we promise. On the highly remote chance that somebody purporting to be from our organisation does try to buy or sell you something, that person is shady and please let us know.
Value of the pay for success (PFS) pipeline in outcomes funds (INDIGO, March 2024)
Average total product impact as calculated by the IWAI product impact dataset – across all industries
The Global Impact Investing Network (GIIN) estimate of the value of the global impact investing market (2022). $1.164 TN.
Impact is a broad field and if you take a wide definition you might consider impact data to include every sales receipt generated by Walmart since they opened their first supermarket.
Analysing or sharing that data, however, is unlikely to be helpful. So instead we try to sift a bit more carefully through what’s out there.
We focus our efforts, instead, on two main activities: impact mapping which involves providing some maps as to which organisations provide impact data (these range from academic institutions through to non-profits and more). And impact visualisation (and publishing) which we’ve already discussed.
We organise this website thematically although we’re always thinking about ways to do a better job at that and separate impact data into its logical interest groups. Let us know if you have suggestions for how to do this better!
Because for every website with AI cartoons there’s a weird human writing prompts wondering what on earth his colleagues must be thinking

This website (the writing and the site, that is) are the product of Daniel Rosehill who manages communications on behalf of Sir Ronald Cohen.
The website is a personal initiative, however, and all statements and opinions are Daniel’s own.
The cartoons are generated with DALLE3.
How and where we try to help on data’s epic journey from datapoint to insight
Somewhere in the world right now, there’s an impact sloth hard at work holding a clipboard and gathering data in the field.
Probably not, but that’s the mental image we’re going to stick with.
When people run impact programs (like impact bonds) they extremely commonly gather data to monitor and assess the successfulness of the intervention.
After our data sloths return from their epic trip to the field, they have a suitcase full of data to sift through.
However, for data to be useful to analysts, it needs to be a bit more organised.
We might need to reference this data against previous datasets to assess historical trends, for instance.
We need to do a bit of housework before passing the data onto the next team members.
As much fun as working with data is, it’s a lot more help when there are multiple brains looking at it.
Besides, if we’re dealing with public data, the taxpayer really owns it.
We share our dataset on a data publishing platform and make it available for anyone to download.
ImpactDB offers itself as a resource between the original publishers of data and those who might ultimately want to look more closely at it – like journalists but also the general public.
We try to gather useful datapoints and break them down so that they’re easier to work with.
Those in the ESG world might feel differently, but these are some of the places where we see meaningful differences:
Impact encourages the growth of companies that are net-positive: creating measurable positive impact while being finanically viable, and ideally successful. We think that merely avoiding harm isn’t enough.
Although not everyone in the impact world agrees with the idea that impact should be mandated by regulators, the idea that regulation should come from an external source is a prevalent one. The rationale: there’s too much potential for greenwashing in reporting frameworks that companies create and guide.
Tell us about yourself and we’ll find a matching animal to give thoughts on your haircut and offer unsolicited life advice
It’s a challenge to make charts look good on small screens like mobile devices. For best results, use a laptop or a desktop. If you’re an elephant, we’re not sure what to recommend.
Try hovering over a datapoint to see if it will make something happen on the screen. At worst, you’ve wasted a tenth of a calorie and moved your hand an inch for now reason. Potentially, you’ll discover greatness.
Data visualiastion is actually a lot harder than hitting some buttons and making pie charts appear. There are a lot of moving parts that we’re figuring out as we go along. Give us time. Come back in 3 months, or 6. Or …
This project was never intended to be anything other than an attempt to analyse and share existing data and share it with whoever might stumble upon our site.
Data begins its journey towards obsolescence the very second it’s generated.
If you’re considering writing about data, it’s a good idea to check in with whoever collected it – whether they’re the original publisher or just somebody who wrote about the datapoint.
Thank you for visiting!
Note: This website is in active development and our data sandbox is currently invite-only.
Please bear with us while we work on our presentation, fix typos, and chat with changemakers!